Try , ,
Whole-proteome volcano
Differential protein abundance across the proteome, for the comparison named on the x axis. Each point is a protein; click one to open its per-gene view. Dashed guides mark ±1.5-fold and p = 0.05.
Bulk download
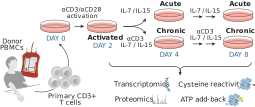
Full processed data as CSV. Fold changes are log₂ from D2,
except columns named X_vs_Y, which are log₂(X/Y).